
A badly matched pump does not announce itself. It runs. It delivers flow. Nobody complains. And every year it quietly draws fifteen or twenty kilowatts more than it needed to -- a cost that never appears as a fault report, only as a line on an electricity bill that nobody traces back to the plant room.
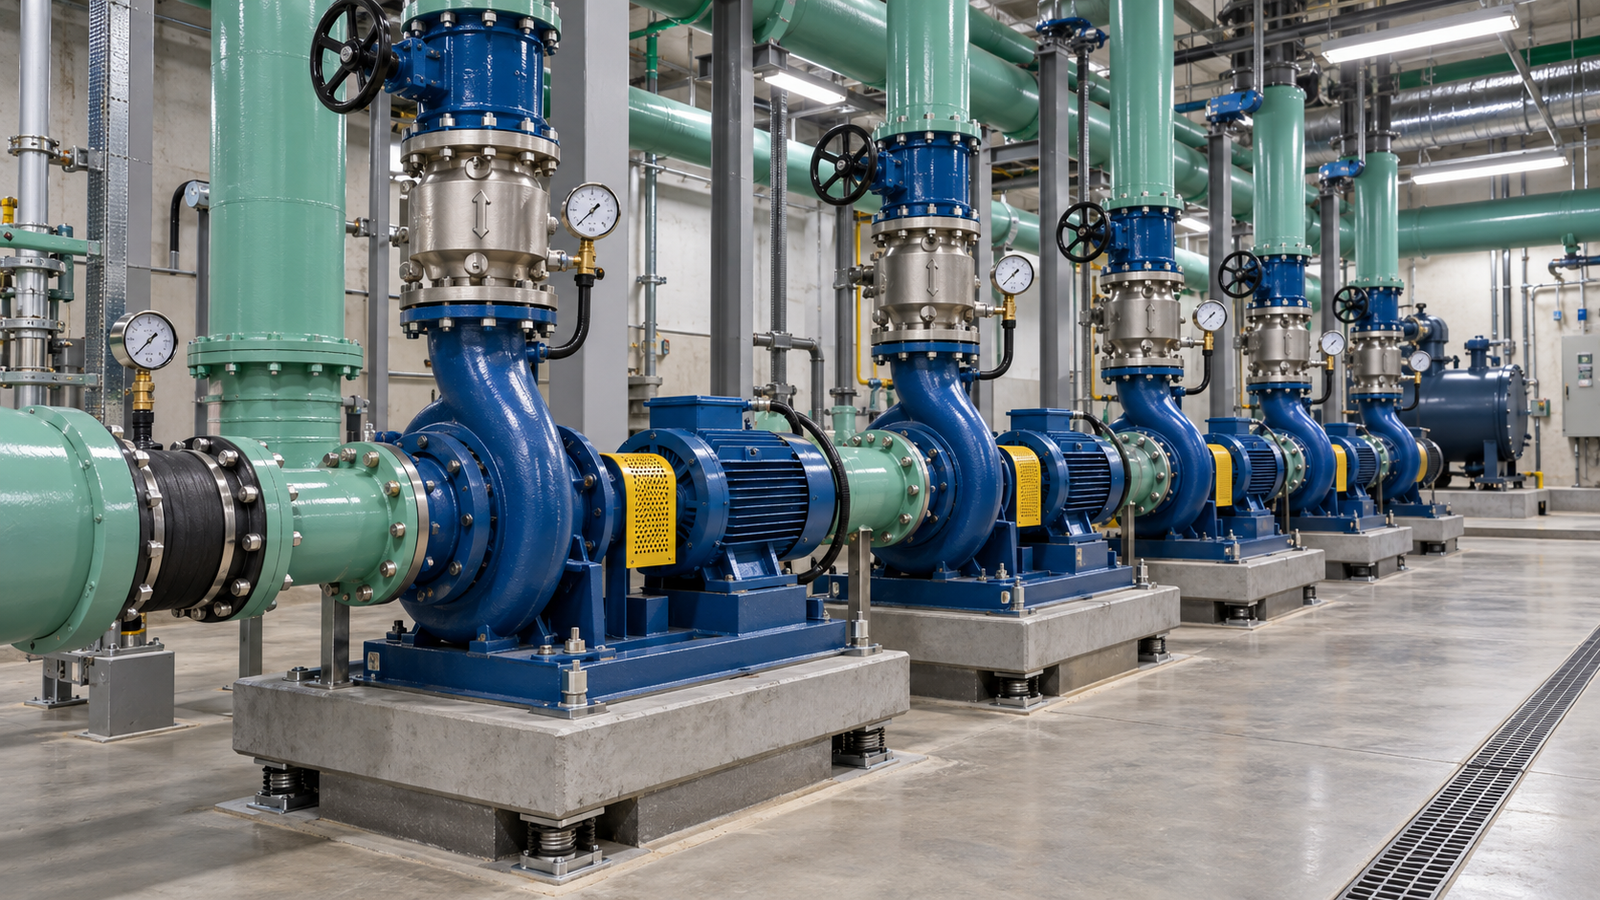
End-suction chilled water pumps with pressure gauges on suction and discharge. Those two gauges are all you need to calculate total head -- and with a power meter, the pump's real efficiency. [REPLACE with your own project photograph or a licensed image.]
- TL;DR
- What Is Pump Efficiency?
- The Pump Efficiency Formula
- Water Horsepower vs Brake Horsepower
- Live Pump Efficiency Calculator
- Worked Calculation Example
- Best Efficiency Point (BEP)
- Interactive Pump Efficiency Curve
- Factors That Influence Pump Efficiency
- Pump Affinity Laws and VFD Savings
- Why Pump Efficiency Matters: Energy & Cost
- Advancing Your HVAC Design Career
- Conclusion
- FAQs
- Sources and Standards Referenced
TL;DR
Key takeaways
- Pump efficiency is hydraulic power out divided by shaft power in: η = QH / 3.67P, with Q in m³/h, H in metres and P in kW.
- Efficiency equals water horsepower divided by brake horsepower -- BHP is always the larger number, because hydraulic, volumetric and mechanical losses sit between them.
- Centrifugal pumps typically run 45–65% efficient below 5 kW, 70–82% in the 5–50 kW range, and 85–90%+ above 100 kW. There is no single "good" number without a size.
- ANSI/HI 9.6.3 defines the preferred operating region as 70–120% of BEP flow; API 610 requires the rated duty point to sit within 80–110% of BEP. Reliability peaks around 90% of BEP flow.
- The affinity laws say flow scales with speed, head with speed squared and power with speed cubed -- so 80% speed draws roughly 51% power. This is the entire case for variable speed pumping.
- Over a 20-year life, energy typically dominates a pump's total cost of ownership far more than its purchase price.
What Is Pump Efficiency?
Pump efficiency is the ratio of the hydraulic power the pump delivers to the fluid to the shaft power delivered into the pump. Everything that does not come out as useful flow and head comes out as heat, noise and vibration.
That definition contains a distinction people routinely blur, and it is worth nailing down before any arithmetic: pump efficiency is not motor efficiency, and neither is the same as wire-to-water efficiency.
If you measure electrical input at the panel and divide hydraulic power by it, you have calculated wire-to-water efficiency, not pump efficiency -- and you will report a number several points lower than the pump's actual performance. On a VFD-driven pump there is a third loss to account for as well, usually 2–4%.
Overall Efficiency Is a Product of Three Sub-Efficiencies
For readers who want the layer underneath, a pump's overall efficiency decomposes into three components that multiply together:
- Hydraulic efficiency -- losses from friction, turbulence, shock at the impeller inlet and flow separation inside the volute. Largest of the three, and most sensitive to how far you are operating from BEP.
- Volumetric efficiency -- losses from internal recirculation, where fluid that has already been pressurised leaks back through wear ring clearances to the suction side. This is the component that degrades most predictably with age.
- Mechanical efficiency -- losses in bearings, seals and disc friction on the impeller shrouds. Generally the smallest of the three.
Illustrative values. Because the three components multiply, a modest shortfall in any one of them pulls the whole figure down — which is why a pump can be mechanically sound and still perform poorly if wear rings have opened up.
Typical Efficiency Ranges
Efficiency scales with size. Losses that are proportional to surface area matter less as volume grows, so a large pump is inherently more efficient than a small one of the same design quality. Judging a 3 kW pump against a 300 kW pump's efficiency is a category error.
| Pump shaft power | Typical η at BEP | Typical HVAC application |
|---|---|---|
| Below 2 kW | 40–55% | Small circulators, terminal unit loops |
| 2–5 kW | 50–68% | Small chilled water secondary loops, hot water circulation |
| 5–50 kW | 68–82% | Chilled and condenser water pumps, mid-size plants |
| 50–150 kW | 78–87% | Primary chilled water, large condenser water duty |
| Above 150 kW | 85–90%+ | District cooling distribution, large campus plants |
Indicative ranges for clean cold water at BEP with a standard end-suction or split-case design. Actual catalogue values vary with specific speed, impeller type and manufacturer. Always work from the selected pump's certified curve, not a range table.
Master Pump Sizing & HVAC Design
Learn pump efficiency, TDH calculation, chiller plant sizing, and full HVAC system design — structured training for India and GCC MEP careers.
The Pump Efficiency Formula
The working form most MEP engineers use, because it takes flow in the units a flow meter reports and returns a percentage directly:
- Q flow rate, in cubic metres per hour (m³/h)
- H total head, in metres of liquid column
- P shaft power input, in kilowatts (kW)
- 3.67 unit conversion constant — it also returns the answer as a percentage
Where does 3.67 come from? It is not arbitrary. Hydraulic power is ρgQH. Substituting water density 1000 kg/m³, gravity 9.81 m/s², and converting m³/h to m³/s by dividing 3600:
Dividing by shaft power and multiplying by 100 to express the result as a percentage moves the decimal point, giving the familiar working form:
The SI Base-Unit Form
If your flow is already in m³/s -- as it often is in academic problems and process work -- use the unconverted form. It also handles fluids other than water, since density stays explicit:
- ρ fluid density, in kg/m³ (1000 for water)
- g gravitational acceleration, 9.81 m/s²
- Q flow rate, in cubic metres per second (m³/s)
- H total head, in metres
- P shaft power, in watts
This form returns a fraction, so multiply by 100 for a percentage. Watch the fluid: glycol solutions in chilled water systems are both denser and more viscous than water. Density enters the equation directly; viscosity does not, but it degrades the pump's actual performance against its water-based catalogue curve, so both need accounting for.
The mistake that invalidates the whole calculation
Head must be total head, not discharge gauge pressure. Total head is the difference between discharge and suction heads, corrected for the elevation difference between the two gauges and, strictly, for velocity head where suction and discharge pipe sizes differ. On a pump with a flooded suction from a tank, forgetting to subtract the positive suction head can overstate head by several metres and inflate the calculated efficiency past 100% -- which is the usual clue that something has gone wrong. To convert: 1 bar ≈ 10.2 m of water column; 1 kg/cm² ≈ 10 m.
Water Horsepower vs Brake Horsepower
The same relationship in imperial units, which you will meet on any US-origin pump curve and in most manufacturer selection software.
- Water horsepower (WHP) -- also called hydraulic horsepower. The power actually imparted to the fluid. This is the useful output.
- Brake horsepower (BHP) -- the power delivered to the pump shaft by the driver, measured as if by a brake dynamometer on the shaft. Always larger than WHP.
- Q flow rate, in US gallons per minute
- H total head, in feet
- SG specific gravity — 1.0 for water
Which closes the loop back to the same definition of efficiency:
The 3960 constant carries the same job as 367 in the metric form: it converts gallons per minute and feet into horsepower, via water's weight of 8.34 lb/gal and the definition of one horsepower as 33,000 ft·lb/min (33,000 ÷ 8.34 ≈ 3,957, rounded to 3,960 by convention).
| From | To | Multiply by |
|---|---|---|
| m³/h | L/s | 0.2778 |
| m³/h | US GPM | 4.403 |
| L/s | US GPM | 15.85 |
| m³/s | m³/h | 3600 |
| metres head | feet head | 3.281 |
| bar | metres water column | 10.2 |
| kg/cm² | metres water column | 10.0 |
| kW | hp | 1.341 |
Live Pump Efficiency Calculator
Enter your measured or catalogue values. The calculator handles unit conversion, reports both metric and imperial forms, and separates pump efficiency from wire-to-water efficiency.
Worked Calculation Example
A centrifugal pump on a condenser water duty. Site measurements taken at the design operating point:
- Flow rate Q = 0.2 m³/s
- Total head H = 27 m
- Shaft power input P = 65 kW
- Fluid: clean water, ρ = 1000 kg/m³
-
Calculate hydraulic powerPhyd=ρgQH=1000×9.81×0.2×27Phyd = 52,974 W = 52.97 kW
-
Divide output by inputη=52.9765η = 0.815, or 81.5%
-
Cross-check using the practical form
First convert the flow: 0.2 m³/s × 3600 = 720 m³/h.
η%=720×273.67×65=19,440238.55η = 81.5% — both methods agree -
Account for the lossesPloss=65−52.9712.03 kW lost inside the pump
Dissipated as heat into the fluid, bearing and seal friction, and noise. On a closed chilled water loop, that heat is a load the chiller then has to remove.
-
Find what the motor actually draws
Assuming a motor efficiency of 93%:
Pelec=650.93=69.9kWηwire-to-water=52.9769.975.8% wire-to-waterNote the gap: 81.5% at the pump, 75.8% at the meter. Quote the wrong one in a report and your numbers will not reconcile with the electricity bill.
81.5% is a good result for a pump of this size. But it tells you nothing on its own about whether the pump is well selected -- only that at this particular duty point it is converting shaft power efficiently. For that judgement you need the curve.
Best Efficiency Point (BEP)
A pump does not have "an efficiency." It has an efficiency curve. The Best Efficiency Point is the flow rate at which that curve peaks -- the flow the impeller was hydraulically designed for, where fluid enters the vanes at the correct angle with minimum shock loss and hydraulic forces around the impeller are most nearly balanced.
Move away from BEP in either direction and two things happen at once. Efficiency falls, which costs money. And the radial hydraulic load on the impeller becomes unbalanced, which costs bearing life, seal life and eventually shaft life. The second effect is the one that gets underestimated.
What the standards actually say
ANSI/HI 9.6.3 (Rotodynamic Pumps -- Guideline for Allowable Operating Region) defines the Preferred Operating Region (POR) as the range of flows either side of BEP within which hydraulic efficiency and operational reliability are not substantially degraded. For most rotodynamic pumps running at or below 4,500 rpm, the POR is 70% to 120% of BEP flow; for specific speeds above 4,500 (US customary units) it narrows to 80–120%. The Allowable Operating Region (AOR) is wider and manufacturer-defined -- commonly cited around 50–125% of BEP for large pumps -- and represents where service life is reduced but still within design limits. Separately, API 610 requires the rated duty point to fall within 80% to 110% of BEP. Published reliability data indicates pump reliability actually peaks at around 90% of BEP flow and falls away quickly beyond that, more steeply on the high-flow side.
Why Engineers End Up Off BEP
Almost always the same reason: the pump was selected against an inflated system head calculation. Safety factors get stacked -- 10% on the pressure drop piping friction estimate, another 10% on the coil pressure drop, a round-up to the next standard impeller -- and the pump is delivered oversized. Once installed, the excess head has to go somewhere, so the balancing valve is throttled. The pump now operates left of its design point, wasting energy across a valve, and often outside the POR.
This is why the design-stage head calculation matters far more than it appears to. An honest system curve produces a pump that lands on BEP; a padded one produces a pump that never can.
Interactive Pump Efficiency Curve
Below is a representative centrifugal pump curve -- head, efficiency and shaft power plotted against flow, with the BEP and the ANSI/HI operating regions marked. Drag the slider to move the operating point and watch what happens to efficiency, power and the reliability verdict.
Figure 1: Interactive centrifugal pump efficiency curve. Head falls as flow rises, efficiency peaks at BEP, and shaft power climbs continuously -- which is why a pump running far right of BEP can overload its motor. Operating regions per ANSI/HI 9.6.3.
The Same Curve as a Table
| % of BEP | Flow (m³/h) | Head (m) | Efficiency (%) | Shaft power (kW) | Region |
|---|---|---|---|---|---|
| 50% | 100 | 37.5 | 61.5 | 16.6 | AOR edge |
| 60% | 120 | 36.4 | 68.9 | 17.3 | AOR |
| 70% | 140 | 35.1 | 74.6 | 17.9 | POR edge |
| 80% | 160 | 33.6 | 78.7 | 18.6 | API rated window |
| 90% | 180 | 31.9 | 81.2 | 19.3 | Peak reliability |
| 100% (BEP) | 200 | 30.0 | 82.0 | 19.9 | Best efficiency |
| 110% | 220 | 27.9 | 81.2 | 20.6 | API rated window |
| 120% | 240 | 25.6 | 78.7 | 21.3 | POR edge |
| 130% | 260 | 23.1 | 74.6 | 21.9 | Outside POR |
| 140% | 280 | 20.4 | 68.9 | 22.6 | Outside AOR |
Illustrative curve generated from a symmetric efficiency model for teaching purposes. Real pump curves are asymmetric -- efficiency typically falls off more steeply to the right of BEP than to the left. Always work from the manufacturer's certified curve.
Read the power curve, not just the efficiency curve
Notice that shaft power in Table 3 climbs continuously with flow -- from 16.6 kW to 22.6 kW -- even though efficiency peaks in the middle. For a typical low-to-medium specific speed centrifugal pump, the power curve is non-overloading only up to a point. If the system resistance turns out lower than calculated on commissioning day, the pump runs out to the right on its curve, draws more power than the selection predicted, and trips the motor overload. That is a very common commissioning callout, and the fix is usually a trimmed impeller rather than a bigger motor.
Factors That Influence Pump Efficiency
Design Factors -- Fixed at Selection
- Specific speed (Ns). The dimensionless shape parameter N√Q / H0.75 that classifies impeller geometry from radial to mixed to axial flow. Attainable peak efficiency is a function of specific speed -- there is an optimum band, and duties that fall far outside it simply cannot reach high efficiency regardless of build quality.
- Impeller design and surface finish. Vane profile, number of vanes, inlet angle and cast surface roughness all set the hydraulic loss floor. On small pumps especially, surface finish is a meaningful fraction of total loss.
- Volute or diffuser design. The casing has to convert velocity to pressure with minimum turbulence, and it can only do this optimally at one flow -- which is precisely what defines BEP.
- Impeller trim. A trimmed impeller is cheaper than a new pump but costs efficiency, because the trimmed vane tips no longer match the volute cutwater. Expect a few points of loss on a significant trim.
- Physical size. As covered in Table 1, bigger is inherently more efficient. Clearances and surface friction do not scale down proportionally.
Operating Factors -- What Degrades It in Service
- Wear ring clearance opening up. The single biggest cause of gradual efficiency loss. As clearances widen, more already-pressurised fluid recirculates internally back to suction, and volumetric efficiency falls. Restoring wear rings to original clearance is one of the highest-return pump overhaul actions available.
- Operating far from BEP. Off-design flow means shock loss at the impeller inlet and flow separation in the volute. As Table 3 shows, running at 50% of BEP costs over 20 efficiency points on this curve.
- Throttled discharge valves. Throttling to control flow burns energy across a valve to correct a selection error. The pump itself may still be efficient; the system is not. This is exactly the waste a VFD eliminates.
- Cavitation. When suction pressure falls below the vapour pressure of the liquid, vapour bubbles form and collapse violently on the impeller. Efficiency drops, noise rises to a distinctive gravel-in-the-casing sound, and impeller material is progressively eroded away.
- Fluid viscosity. Glycol solutions in chilled water systems raise both density and viscosity. Higher viscosity increases disc friction and hydraulic loss, reducing head and efficiency relative to the water-based catalogue curve -- corrections must be applied, not ignored.
- Fouled strainers and pipework. Rising system resistance shifts the operating point left along the pump curve. The pump has not changed; its duty point has.
Catalogue efficiency carries a tolerance
The efficiency printed on a pump curve is not a guaranteed floor unless you specify the acceptance grade. ISO 9906:2012 -- and its Hydraulic Institute equivalents ANSI/HI 14.6 and 11.6 -- define performance test acceptance grades (1, 2 and 3, with bilateral and unilateral variants) that set the tolerance band applied to test data when judging whether a pump meets its guarantee. Efficiency carries a negative-only tolerance, and the tighter grades cost more to certify. If efficiency is contractually important on your project, name the grade in the specification rather than assuming the curve is exact.
Pump Affinity Laws and VFD Savings
The affinity laws describe how a pump's performance scales when you change its speed or impeller diameter. For a speed change on a fixed impeller:
Efficiency stays approximately constant across modest speed changes, which is what makes the relationships usable in the first place.
| Speed | Flow (m³/h) | Head (m) | Power (kW) | Power saving |
|---|---|---|---|---|
| 100% | 200 | 30.0 | 19.90 | — |
| 95% | 190 | 27.1 | 17.06 | 14.3% |
| 90% | 180 | 24.3 | 14.51 | 27.1% |
| 85% | 170 | 21.7 | 12.22 | 38.6% |
| 80% | 160 | 19.2 | 10.19 | 48.8% |
| 70% | 140 | 14.7 | 6.83 | 65.7% |
| 60% | 120 | 10.8 | 4.30 | 78.4% |
The caveat that most articles leave out
The affinity laws describe the pump, not the system. They hold exactly only when the operating point moves along a system curve that passes through the origin -- that is, a purely friction-dominated system with zero static head. Add static lift (an open cooling tower basin, a rooftop tank, an open circuit) and the system curve starts on the vertical axis instead. The pump now cannot follow the cube law, because it must still generate the static head no matter how slowly it turns. Real savings are smaller, and below a certain speed the pump stops delivering flow altogether. Closed chilled water loops are largely friction-dominated and come closest to the ideal; open condenser water circuits with tower lift do not. Always plot the actual system curve before promising a client a cube-law saving.
Why Pump Efficiency Matters: Energy and Cost Impact
Pumping is one of the largest single consumers of electricity in the built environment, and in an HVAC plant the chilled water and condenser water pumps typically run more hours per year than almost anything else on site -- often continuously through the cooling season.
The financial shape of a pump is unusual and worth internalising early: over a typical 15 to 20 year service life, energy dominates total cost of ownership, frequently exceeding purchase price by an order of magnitude. Maintenance sits somewhere in between. This is why life cycle cost analysis, not first cost comparison, is the correct basis for pump selection -- and why a 4-point efficiency difference that looks trivial on a datasheet is anything but.
Take a single pump on a 200 m³/h duty at 30 m head, running 6,000 hours a year at ₹9 per kWh.
| Pump efficiency | Shaft power | Annual consumption | Annual cost |
|---|---|---|---|
| 82% | 19.94 kW | 119,625 kWh | ₹10.77 L |
| 77% | 21.23 kW | 127,393 kWh | ₹11.47 L |
| Difference | 1.29 kW | 7,768 kWh | ₹0.70 L per year |
Over a fifteen-year life that is ₹10.5 lakh — from one pump, from a difference of five percentage points that would barely register when scanning a datasheet. Now multiply by the number of pumps in the plant room, and by the duty and standby sets across a campus.
India context: where the efficiency levers actually sit
India's BEE Standards & Labelling programme star-rates several pump categories -- monoset pumps, openwell and borewell submersible pump sets and agricultural pumpsets -- but these are domestic and agricultural products rather than the end-suction and split-case pumps used in commercial HVAC plant rooms. For building services pumps, the practical levers are the Energy Conservation Building Code (ECBC), which sets equipment and system efficiency requirements for commercial buildings, and the motor efficiency class: BEE separately star-rates General Purpose Industrial Motors, and IE2/IE3 classification under IS 12615 governs what you can specify. Since wire-to-water efficiency is the product of pump, motor and drive efficiency, specifying a high-efficiency motor is often the easiest point to gain -- and the easiest to lose by defaulting to whatever the pump vendor bundles.
Advancing Your HVAC Design Career with Augmintech
The formula in this article takes about ninety seconds to learn. What takes longer -- and what actually gets people hired into design roles -- is the workflow around it. Understanding MEP engineer roles shows exactly where pump selection and system curve work sits within the wider project team.
A working design engineer does not calculate efficiency from a given shaft power. They build the system curve from pipe lengths, fittings, coil and valve pressure drops and static lift; they overlay it on candidate pump curves; they select the machine whose BEP lands on the duty point; they specify the impeller diameter, the motor rating with the right margin above end-of-curve power, and the VFD control strategy; and they produce a pump schedule a contractor can procure from. Efficiency is one number inside that process, not the process itself.
That end-to-end workflow -- and its direct connection to the HVAC chilled water systems the pumps serve -- is what the HVAC Design Complete Course is built around, using real project drawings and the selection software design offices actually run. If you want the fundamentals it sits on first, start with HVAC design fundamentals.
Conclusion
Two things to carry out of this article.
The formula: η = QH / 3.67P, with Q in m³/h, H in metres of total head and P as shaft power in kW. Equivalently, efficiency is water horsepower divided by brake horsepower. Get the head right and the arithmetic is trivial.
The concept: a pump has an efficiency curve, not an efficiency. Where your duty point sits on that curve relative to BEP determines not only what you pay in energy but how long the bearings and seals last. Select so the duty point lands inside 80–110% of BEP, resist the urge to pad the head calculation, and let a VFD -- not a throttling valve -- absorb whatever variation remains.
Frequently Asked Questions
Sources and Standards Referenced
- ANSI/HI 9.6.3 -- Rotodynamic (Centrifugal and Vertical) Pumps: Guideline for Allowable Operating Region, Hydraulic Institute. Source of the POR (70–120% of BEP) and AOR definitions.
- API Standard 610 -- Centrifugal Pumps for Petroleum, Petrochemical and Natural Gas Industries. Source of the 80–110% of BEP rated-point requirement.
- ISO 9906:2012 -- Rotodynamic pumps: Hydraulic performance acceptance tests, Grades 1, 2 and 3. Source of performance test tolerance grades; equivalents are ANSI/HI 14.6 and ANSI/HI 11.6.
- Bureau of Energy Efficiency, Government of India -- Standards & Labelling programme, beestarlabel.com. Covers monoset pumps, openwell and submersible pump sets, agricultural pumpsets and general purpose industrial motors.
- Energy Conservation Building Code (ECBC), Bureau of Energy Efficiency -- equipment and system efficiency requirements for commercial buildings in India.
- IS 12615 -- Line Operated Three-Phase AC Motors (IE Code): efficiency classes IE1 to IE4 as applied in India.
Standards are revised on fixed cycles. Confirm the edition applicable to your project before issuing a specification. This article was last verified against the sources above on 1 August 2026.